01
Electrocatalysts
Select catalyst compositions before electrode or cell tests.
We test mixed-metal catalyst libraries to measure localized activity, stability, and surface change before the next catalyst test.
Platform Characteristics
Deposition-to-characterization path.
02
Physical sample library
Create a real composition-spread thin-film library with 342 registered measurement positions.03
Composition map
Map element ratios by EDX/EDS or WDX for the material system.04
Structure and properties
Measure XRD phase data and selected electrical, mechanical, optical, magnetic, or electrochemical response.05
Scoped follow-up
Scanning droplet cell (SDC), SECCM, XPS, microscopy, or interface analysis can be added when surface change or a localized measurement decides the next step.06
Next experiment
Measured maps, Bayesian optimization, or Gaussian-process selection support repeat samples or a narrower campaign.Material decision
Where this applies.
Relevant areas
Relevant systems include OER, HER, ORR, corrosion-relevant electrochemical surfaces, and CO2 electroreduction screens with defined product-analysis protocols.
Experimental plan
Prepare a co-sputtered catalyst library, map composition and phase, screen local electrochemical response, and select regions for follow-up samples.
Examples
- Water electrolysis OER and HER
- ORR and mixed electrochemical surface studies
- CO2 electroreduction with defined product analysis
- Corrosion-relevant catalyst surfaces
Methods used
- magnetron co-sputtering
- EDX/EDS or WDX composition mapping
- XRD phase mapping
- scanning droplet cell (SDC)
- SECCM for higher-resolution local electrochemistry
- Bayesian or data-guided follow-up
Measurements
- composition
- phase
- localized current response
- activity indicator
- early stability indicator
- surface change
Outputs
- activity-stability maps
- candidate catalyst regions
- regions to avoid
- follow-up uniform depositions
What comes back: Measured catalyst composition ranges for full-cell, assembled-stack, or product-analysis testing.
Figures
Catalyst-library method figures.
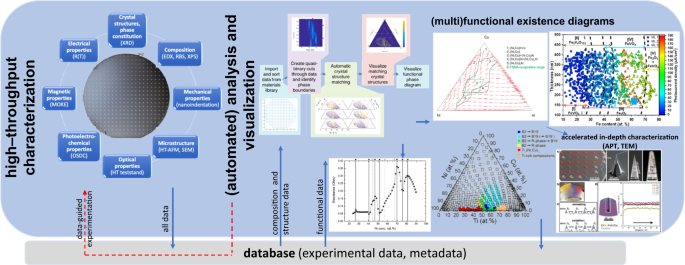
Library-scale characterization
Composition, structure, magnetic, electrical, optical, mechanical, and microstructure measurements feed measured maps.Ludwig, npj Comput. Mater. 2019, Fig. 2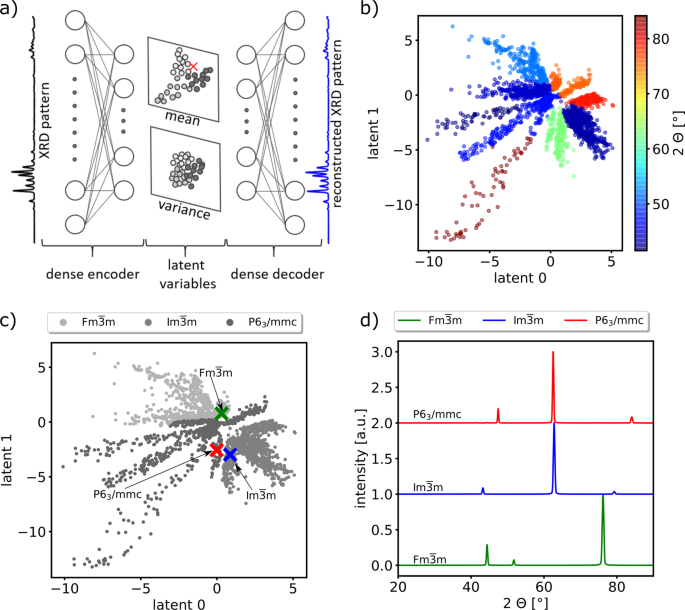
XRD latent-space analysis
Large diffraction datasets are organized by phase similarity and structure signals before regions are selected.Banko et al., npj Comput. Mater. 2021, Fig. 1Closest Evidence
Closest published catalyst demonstrations.
Thelen et al., Adv. Sci. 2025
Ni-Pd-Pt-Ru OER selection
Combinatorial sputtering, high-throughput characterization, Bayesian optimization, and follow-up OER tests connect measured libraries to catalyst choice.Open sourceBanko et al., Adv. Energy Mater. 2022
High-entropy catalyst trends
Composition, activity, and stability were mapped across high-entropy alloy electrocatalyst libraries.Open sourceBanko et al., arXiv 2021
Source-permutation catalyst search
Source-position permutations were used to sample quinary high-entropy alloy electrocatalyst space.Open sourcePlatform Basis
Methods behind the screen.
Ludwig, npj Comput. Mater. 2019
Combinatorial thin-film synthesis, high-throughput characterization, data handling, and composition-property mapping.Open sourceRUB ELAN nanoelectrochemistry
Scanning electrochemical methods for local measurements on defined material regions.Open sourceReferences
Cited sources.
Thelen, F.; Zehl, R.; Zerdoumi, R.; Burgel, J. L.; Banko, L.; Schuhmann, W.; Ludwig, A. Accelerating Combinatorial Electrocatalyst Discovery with Bayesian Optimization: A Case Study in the Quaternary System Ni-Pd-Pt-Ru for the Oxygen Evolution Reaction. Adv. Sci. 2025, 12 (35), e07302.
Ni-Pd-Pt-Ru catalyst libraries, high-throughput characterization, Bayesian optimization, and follow-up OER testing.
Banko, L.; Krysiak, O. A.; Pedersen, J. K.; Xiao, B.; Savan, A.; Loffler, T.; Baha, S.; Rossmeisl, J.; Schuhmann, W.; Ludwig, A. Unravelling Composition-Activity-Stability Trends in High Entropy Alloy Electrocatalysts by Using a Data-Guided Combinatorial Synthesis Strategy and Computational Modeling. Adv. Energy Mater. 2022, 12, 2103312.
Composition, activity, and stability trends in high-entropy alloy electrocatalyst libraries.
Banko, L.; Tetteh, E. B.; Kostka, A.; Piotrowiak, T. H.; Krysiak, O. A.; Hagemann, U.; Andronescu, C.; Schuhmann, W.; Ludwig, A. Microscale Combinatorial Libraries for the Discovery of High-Entropy Materials. Adv. Mater. 2023, 35, 2207635.
Microscale combinatorial libraries for high-entropy materials and denser local composition coverage.
Banko, L.; Krysiak, O. A.; Xiao, B.; Loffler, T.; Savan, A.; Pedersen, J. K.; Rossmeisl, J.; Schuhmann, W.; Ludwig, A. Combinatorial materials discovery strategy for high entropy alloy electrocatalysts using deposition source permutations. arXiv 2021, arXiv:2106.08776.
Combinatorial source-position strategy for sampling quinary electrocatalyst composition spaces.
Strotkoetter, V.; Krysiak, O. A.; Zhang, J.; Wang, X.; Suhr, E.; Schuhmann, W.; Ludwig, A. Discovery of High-Entropy Oxide Electrocatalysts: From Thin-Film Material Libraries to Particles. Chem. Mater. 2022, 34 (23), 10291-10303.
High-entropy oxide electrocatalyst screening from thin-film libraries toward particle validation.
RUB ELAN nanoelectrochemistry
Scanning electrochemical methods for local measurements on defined material regions.
Ludwig, A. Discovery of new materials using combinatorial synthesis and high-throughput characterization of thin-film materials libraries combined with computational methods. npj Comput. Mater. 5, 70 (2019).
Combinatorial thin-film synthesis, high-throughput characterization, data handling, and composition-property mapping.